Debugging tools
Contents
Using the compiler
The easiest and always available tool for code validation is the compiler. Most modern compilers have many debugging flags, which can help to find different kinds of bugs in a code. This article should provide a guideline or checklist for validating arbitrary code.
Checks during the compilation
First step is clearly to compile the code and to remove all errors which are reported by the compiler. While this is an indispensable prerequisite for code development, the compiler is able of much more checking. After the code compiles with some standard flags needed for the code, one can add warning flags, which cause the compiler to issue warnings about suspicious code structures, unused variables or arguments. For the Intel Compiler, this is added by (the … are the other compiler arguments)
ifort -warn all ...
for the GNU compiler it is
gfortran -Wall ...
In principle all of these warnings should be considered and removed, but sometimes, one does not want to have some special warnings (for example about unused variables), then one can disable some of the warnings by
ifort -warn all -diag-disable [ID of the warning] ...
where the ID is given at the output of the warning.
Run-time checks
If all warnings are worked on, one can go a step further and run the code. The results have to be carefully checked by the user, as no tool is able to do this. But what the compiler can do are some run-time checks. The most important are the boundary checks (in Fortran programs) of arrays. But there are some other checks like usage of uninitialized variables or the creation of temporary arrays. These checks can be switched on at compile time with
ifx -g -traceback -O0 -check all ...
It is usually a good idea to also add flags that cause the compiler to include information about the source code into the executable to better find the location of the reported errors. For the same reason, disabling optimization also helps in finding errors. For GNU, these run-time checks can be switched on by
gfortran -g -fbacktrace -O0 -fcheck=all ...
These checks are important and often help to find hidden errors, which only come up in some situations (and are then difficult to debug).
Floating point exceptions
A further run-time check is the check for floating point exceptions, like division by zero and so on. This can be established by
ifort -g -traceback -fpe0 ...
and
gfortran -g -fbacktrace -ffpe-trap=invalid,zero,overflow ...
Linaro DDT
DDT, the Distributed Debugging Tool from Linaro (formerly Allinea, then ARM), is a comprehensive graphical debugger for scalar, multi-threaded and large-scale parallel applications, written in C, C++ or Fortran.
The MPCDF holds a license for a total of 256 processes.
DDT is installed on the High-Performance Computing systems and on the Linux compute clusters.
For MPI applications, it is possible to either debug a job running on the compute nodes, or to debug a small application (no more than 4 processes) on the interactive nodes.
Option 1: Utilization of interactive nodes
If the debugging session can be performed with up to 4 processes and memory requirements do not exceed the capacity of a single node, the utilization of an interactive node is possible as follows:
Access to the interactive node from the cluster, enabling the X11 forwarding (graphics) and compression.
ssh -YC user@raven-i.mpcdf.mpg.de
Load arm_ddt and the desired version of compiler and mpi.
module load intel impi arm_ddt
Launch the debugger.
ddt
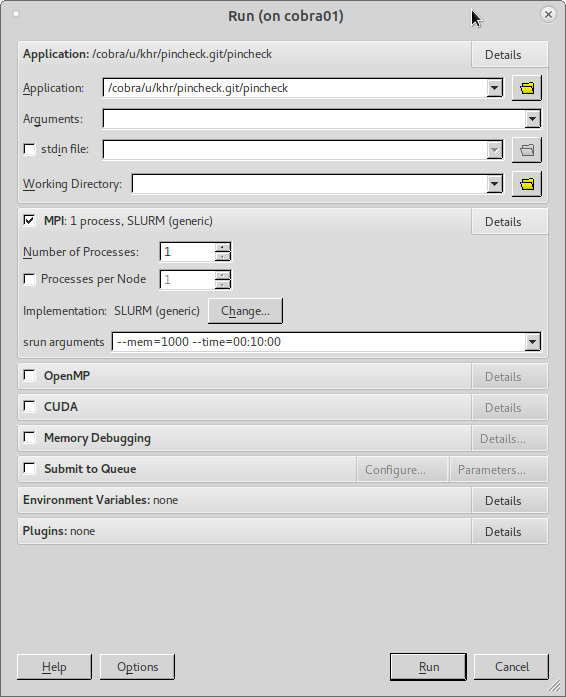
Configure your debugging session:
Firstly, indicate your binary (compiled with debugging symbols), working directory and application parameters.
Secondly, set up the number of MPI processes, define the field ‘implementation’ as ‘SLURM (generic)’, and define the mandatory srun arguments for memory and estimated job time (’–mem=XX’ and ‘–time=YY’).
Finally, press the ‘Run’ button and wait for the slurm response allowing the debugging session.
Option 2: debugging a BATCH job
The process of debugging a scheduled job is advised when a larger setup needs to be debugged. To perform a debugging session with a job running on the compute nodes, first it is necessary to start a ddt gui (graphical user interface) and afterwards to submit a job with a special command that is going to attach your job with your already running ddt session.
First, access the cluster’s login node enabling the X11 forwarding (graphics) and compression.
ssh -YC user@raven-i.mpcdf.mpg.de
Load the arm ddt debugger.
module load arm_ddt
Launch the debugger gui. You can use the ‘&’ which will execute the program in the background.
ddt &
Second, you need to modify your job submission script as follows:
By adding a module load command for the arm_ddt
module load arm_ddt
And by updating your srun command line by inserting ‘ddt –connect’ before the call.
## srun ./binary
ddt --connect srun ./binary
Third, launch your updated job from the same node where the GUI is running, and wait for the allocation on the compute nodes. Once the job scheduler (SLURM) has assigned the resources, the ddt gui will be attached and the debugging session will start.
sbatch myjobscript.bash
Example of a job script for debugging a simple hybrid application (pincheck) running on 4 Raven nodes.
##!/bin/bash -l

##SBATCH -o ./job.out.%j
##SBATCH -e ./job.err.%j
##SBATCH -D ./
##SBATCH -J DDT
##SBATCH --nodes=4
##SBATCH --ntasks-per-node=2
##SBATCH --cpus-per-task=36
##SBATCH --mail-type=none
##SBATCH --time=01:00:00

export OMP_NUM_THREADS=36

module purge
module load intel impi
module load arm_ddt

ddt --connect srun ./pincheck
Further information:
Forcheck
Forcheck is a tool for static verification of the correctness of Fortran 77, 95 and 2003 programs. It also supports treatment of interface checking including module dependencies via a facility of creating Forcheck-specific library files.
Forcheck is installed on x86 Linux cluster systems and can be initialized by invoking
module load forcheck
Then, the following executables are available:
forchkfor checking of Fortran syntaxinterffor generation of explicit interfaces from Forcheck library filesfcklibfor maintaining Forcheck library files
Installed versions are frozen at version 14 of the tool and provided as is.
Intel Trace Analyzer and Collector (ITAC)
In addition to its comprehensive MPI profiling capabilities the Intel Trace Analyzer and Collector (ITAC) provides a tool for checking MPI correctness (detect deadlocks, …).
ITAC is installed on x86 Linux cluster systems as well as the HPC systems. Under Intel-MPI the MPI correctness check can be enabled with
module load intel impi itac
mpiexec -check-mpi ./a.out
In Slurm batch environments, where srun is the preferred MPI launcher,
the following method with LD_PRELOAD can be used:
module load intel impi itac

export LD_PRELOAD=$VT_SLIB_DIR/libVTmc.so:$I_MPI_ROOT/lib/debug/libmpi.so
srun ./a.out
Intel has announced the end-of-life for ITAC.
Intel Inspector / Thread Checker
The Intel Inspector (formerly known as Intel Thread Checker) is a tool for analyzing and debugging a threaded application.
The tool
helps you create threaded applications by identifying shared and private variable conflicts,
locates threading errors before they occur with an intuitive understanding of threaded application behavior,
isolates threading bugs to the source code line where the bug occurs, showing you exactly where in your program threading errors are likely to happen,
describes possible causes of threading errors and suggested solutions with one-click diagnostic help.
The Thread Checker is installed on x86 Linux cluster systems as well as the HPC systems and can be initialized by invoking
module load inspector
Then, the command inspxe-cl for the command line usage and the
command inspxe-gui for a GUI are available.
For more details please have a look at the following documents:
Intel has announced the end-of-life for Inspector.
Heaptrack
Heaptrack is a memory profiler originally developed for KDE. An overview of its features can be
found here. The command-line version is installed on Raven.
Data collection for the executable a.out can be triggered in a job script in the following way:
module load heaptrack
srun hpcmd_suspend heaptrack ./a.out
A .gz file prefixed with heaptrack will be created in the job submission directory. To print the
collected data to stdout, run heaptrack --analyze on that file. Note that heaptrack does not
support MPI intrinsically, but it will create a separate data file for each rank.
Valgrind
Valgrind is a memory debugging and profiling tool. Documentation can be found at the Valgrind home page.