Performance Monitoring
A comprehensive HPC performance monitoring system is deployed on the HPC systems, where a plethora of performance metrics is collected continuously per socket or per node, enabling MPCDF staff to monitor application performance on a system-wide scale in real time or retrospectively. Users get access to a performance report in PDF format for each of their jobs via a web service.
Introduction
The MPCDF operates HPC systems to provide compute services to scientists from the Max Planck Society. Having performance numbers available for the whole machine, but also down to each individual compute job, is essential for the stakeholders of the HPC systems (i.e. users, administrators, application support, and management). This helps stakeholders firstly, to become aware of potentially suboptimal usage of resources, and secondly, to take action to improve the way these resources are used. A comprehensive HPC performance monitoring system was developed at the MPCDF and is in operation on the HPC systems since fall 2018 to continuously monitor relevant performance metrics on all nodes and for each job. The HPC performance monitoring system is extremely lightweight and operates in the background, invisibly to the user.
PDF Performance Reports for Users
For each HPC job, we provide performance reports as PDF files for download via the following web service:
https://hpc-reports.mpcdf.mpg.de/
After a login with the regular Kerberos credentials, the user first selects the machine of interest. Currently, the reports are available for finished jobs on the Raven HPC system with a runtime of at least 20 minutes. Once a machine was selected, a table of finished jobs is presented. To obtain the PDF performance report for a specific job, please click the ‘Generate’ button first. Depending on the sizeof the job and the load on the system this may take from seconds to minutes. Once the PDF was created, the button label changes from ‘Generate’ to ‘Download’ at the next manual refresh of the page.
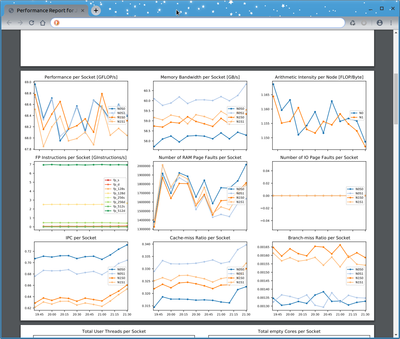
The PDF file comprises multiple pages. On the first page, the most important parameters and environment variables of the job are presented in tabular form. For small jobs, a table with per-socket GFLOP/s and memory bandwidth data is shown. The following pages contain a plethora of plots showing performance data over time, e.g., GFLOP/s, memory bandwidth, retired instructions by SIMD set (scalar, SSE, AVX, AVX512), memory usage, GPU utilization, GPU memory usage, and various metrics from the HPC network and the parallel file systems. For small jobs, these plots are displayed per socket, node, or GPU device. For larger jobs, the data is instead presented in a more statistical way showing minimum, median, and maximum lines. The final page of each report contains extensive documentation and an explanation of each plot. As the system is evolving, the content and presentation of the PDF file may be changed and further improved in the future.
Suspending the Performance Monitoring System for Specific Jobs
The hpcmd software daemon uses the programmable hardware performance monitoring units (PMUs) of the CPUs to continuously measure performance data with negligible overhead. In case a user wants to use those units for the purpose of custom performance measurements, hpcmd needs to be suspended first. This is in particular relevant when one of the following software packages is used: Intel Amplifier XE (VTUNE), Intel Advisor, PAPI, LikWid, perf, and similar tools.
To suspend the instances of hpcmd that monitor the compute nodes during the runtime of a batch job, we provide the wrapper ‘hpcmd_suspend’. Simply put it in between ‘srun’ and the executable you want to run as follows:
srun hpcmd_suspend ./YOUR_EXECUTABLE
After the batch job has ended, hpcmd will re-enable itself automatically. Please do not suspend hpcmd unless you intend to perform your own measurements.
Technical Background
The HPC monitoring daemon (hpcmd) runs in the background on each compute node. Simple and lightweight by design, hpcmd is mostly written in Python. It queries standard Linux command line tools (e.g., perf, ps), virtual file systems (/proc, /sys), and some proprietary tools (e.g., opainfo, nvidia-smi, nvidia-dcgm). Thereby, metrics such as the GFLOP/s, the memory bandwidth, the mix of scalar and vector instructions, memory utilization, GPU utilization, network and disk I/O bandwidths, and many more, are captured on a per-socket or per-node resolution. In addition, hpcmd integrates with the Slurm batch system to gather information such as the jobid, the requested number of nodes, cores, GPUs, etc., to complement the actual performance data. hpcmd runs as a systemd service on each node of the HPC systems and performs measurements over regular 4 minute intervals synchronized between nodes.
Measured and derived values are written to syslog messages, and are finally transferred to a central Splunk database and analytics platform, which enables MPCDF staff to inspect the performance data in real-time or retrospectively. As an entry point to Splunk, all the jobs are shown in a roofline-type of plot, representing a current picture of the system-wide performance. In addition, job-specific dashboards are available, enabling interactive graphical exploration of all the aforementioned performance metrics. Automated analysis based on machine learning technology is currently under development. Users are not allowed to work interactively on the MPCDF-internal Splunk system for licensing and data protection reasons, however they are provided with a static PDF Performance Report containing the full information for their specific job (please see above for details). Note that the HPC performance monitoring system was not designed as a replacement for profiling tools. It can provide, however, valuable information on performance issues, motivating in-depth profiling and code optimization work.
Overhead
hpcmd runs with a reduced scheduling priority (niceness) in the background. The Linux kernel therefore moves hpcmd and its child processes to cores that are not fully used by the application at a given time. Note that Linux perf measures mostly passively using programmable hardware counters, hence the overhead from perf is negligible. After extensive testing and several months in production on two HPC systems, we did not experience any measurable overhead or impact on the applications when running hpcmd in epochs of 10 minutes duration.
Further information
The hpcmd software is open source and available at https://gitlab.mpcdf.mpg.de/mpcdf/hpcmd. Online documentation on hpcmd is available at https://mpcdf.pages.mpcdf.de/hpcmd.
Reference:
Stanisic L., Reuter K., MPCDF HPC Performance Monitoring System: Enabling Insight via Job-Specific Analysis, Euro-Par 2019, Lect. Notes Comput. Sci, 11997 (2020) (arXiv)